 Web Server Statistics www.nvsg-geiss-nidda.de
Program started at Sat-27-Dec-2025 22:45.
Analysed requests from Sat-27-Dec-2025 00:05 to Sat-27-Dec-2025 22:44 (0.94 days).
Web Server Statistics www.nvsg-geiss-nidda.deProgram started at Sat-27-Dec-2025 22:45.
Analysed requests from Sat-27-Dec-2025 00:05 to Sat-27-Dec-2025 22:44 (0.94 days).
(Go To: Top | General Summary | Monthly Report | Daily Summary | Hourly Summary | Domain Report | Organisation Report | Operating System Report | Status Code Report | File Size Report | File Type Report | Directory Report | Request Report)
This report contains overall statistics.
Successful requests: 3,172
Average successful requests per day: 3,360
Successful requests for pages: 1,995
Average successful requests for pages per day: 2,112
Failed requests: 1,492
Redirected requests: 41
Distinct files requested: 2,888
Distinct hosts served: 774
Data transferred: 64.73 megabytes
Average data transferred per day: 68.58 megabytes
(Go To: Top | General Summary | Monthly Report | Daily Summary | Hourly Summary | Domain Report | Organisation Report | Operating System Report | Status Code Report | File Size Report | File Type Report | Directory Report | Request Report)
This report lists the activity in each month.
Each unit ( ) represents 50 requests for pages or part thereof.
| month | reqs | pages | |
|---|---|---|---|
| Dec 2025 | 3172 | 1995 |   |
Busiest month: Dec 2025 (1,995 requests for pages).
(Go To: Top | General Summary | Monthly Report | Daily Summary | Hourly Summary | Domain Report | Organisation Report | Operating System Report | Status Code Report | File Size Report | File Type Report | Directory Report | Request Report)
This report lists the total activity for each day of the week, summed over all the weeks in the report.
Each unit () represents 50 requests for pages or part thereof.
| day | reqs | pages | |
|---|---|---|---|
| Sun | 0 | 0 | |
| Mon | 0 | 0 | |
| Tue | 0 | 0 | |
| Wed | 0 | 0 | |
| Thu | 0 | 0 | |
| Fri | 0 | 0 | |
| Sat | 3172 | 1995 | |
(Go To: Top | General Summary | Monthly Report | Daily Summary | Hourly Summary | Domain Report | Organisation Report | Operating System Report | Status Code Report | File Size Report | File Type Report | Directory Report | Request Report)
This report lists the total activity for each hour of the day, summed over all the days in the report.
Each unit () represents 4 requests for pages or part thereof.
| hour | reqs | pages | |
|---|---|---|---|
| 0 | 96 | 67 |  |
| 1 | 148 | 19 |  |
| 2 | 55 | 19 | |
| 3 | 87 | 70 |  |
| 4 | 93 | 64 | |
| 5 | 140 | 95 | |
| 6 | 194 | 103 | |
| 7 | 138 | 119 | |
| 8 | 138 | 90 | |
| 9 | 173 | 116 | |
| 10 | 123 | 90 | |
| 11 | 128 | 92 | |
| 12 | 133 | 103 | |
| 13 | 308 | 117 | |
| 14 | 128 | 97 | |
| 15 | 78 | 57 | |
| 16 | 101 | 76 | |
| 17 | 131 | 86 | |
| 18 | 183 | 147 | |
| 19 | 193 | 94 | |
| 20 | 194 | 112 | |
| 21 | 131 | 98 | |
| 22 | 79 | 64 | |
| 23 | 0 | 0 |
(Go To: Top | General Summary | Monthly Report | Daily Summary | Hourly Summary | Domain Report | Organisation Report | Operating System Report | Status Code Report | File Size Report | File Type Report | Directory Report | Request Report)
This report lists the countries of the computers which requested files.
Listing domains, sorted by the amount of traffic.
| reqs | %bytes | domain |
|---|---|---|
| 3172 | 100% | [unresolved numerical addresses] |
(Go To: Top | General Summary | Monthly Report | Daily Summary | Hourly Summary | Domain Report | Organisation Report | Operating System Report | Status Code Report | File Size Report | File Type Report | Directory Report | Request Report)
This report lists the organisations of the computers which requested files.
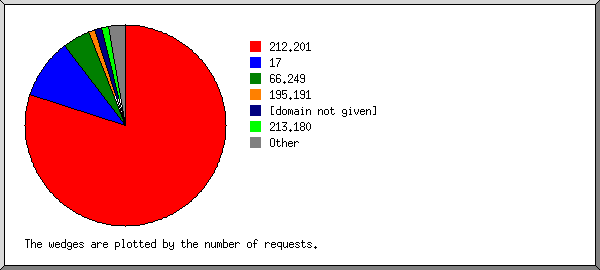
The wedges are plotted by the number of requests.
 52
52
 54
54
 3
3
 44
44
 34
34
 18
18
 23
23
 47
47
 98
98
 66.249
 Other
Other
Listing the top 20 organisations by the number of requests, sorted by the number of requests.
| reqs | %bytes | organisation |
|---|---|---|
| 422 | 9.66% | 52 |
| 422 | 9.10% | 54 |
| 413 | 6.60% | 3 |
| 294 | 8.39% | 44 |
| 279 | 5.83% | 34 |
| 204 | 5.33% | 18 |
| 131 | 3.55% | 23 |
| 122 | 0.78% | 47 |
| 105 | 4.07% | 98 |
| 98 | 11.03% | 66.249 |
| 81 | 1.07% | 100 |
| 64 | 1.28% | 35 |
| 42 | 0.33% | 5 |
| 41 | 0.60% | 50 |
| 35 | 5.40% | 51 |
| 35 | 0.29% | 92 |
| 33 | 0.71% | 184.73 |
| 28 | 0.50% | 107 |
| 23 | 0.68% | 94 |
| 20 | 5.41% | 207.46 |
| 280 | 19.39% | [not listed: 65 organisations] |
(Go To: Top | General Summary | Monthly Report | Daily Summary | Hourly Summary | Domain Report | Organisation Report | Operating System Report | Status Code Report | File Size Report | File Type Report | Directory Report | Request Report)
This report lists the operating systems used by visitors.
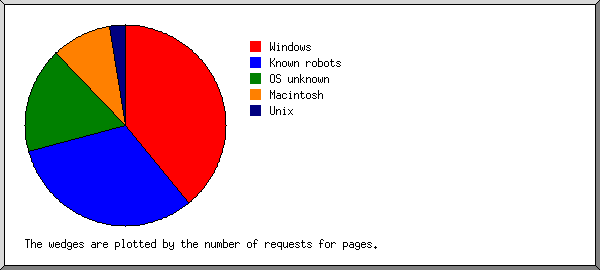
The wedges are plotted by the number of requests for pages.
OS unknown
Known robots
Windows
Other
Listing operating systems, sorted by the number of requests for pages.
| no. | reqs | pages | OS |
|---|---|---|---|
| 1 | 2650 | 1827 | OS unknown |
| 2 | 322 | 98 | Known robots |
| 3 | 60 | 34 | Windows |
| 59 | 33 | Windows 10 / Server 2016 / Server 2019 | |
| 1 | 1 | Windows Vista / Server 2008 | |
| 4 | 45 | 13 | Linux |
| 32 | 10 | Unknown | |
| 13 | 3 | Ubuntu | |
| 5 | 13 | 10 | Apple |
| 10 | 7 | macOS 10.15 (Catalina) | |
| 1 | 1 | macOS 12.0 | |
| 1 | 1 | macOS 10.11 (El Capitan) | |
| 1 | 1 | macOS Unknown | |
| 6 | 55 | 6 | Android |
| 41 | 5 | Android 6.0 (Marshmallow) | |
| 1 | 1 | Android 4.3 (Jelly Bean) | |
| 13 | 0 | Android 7.0 (Nougat) | |
| 7 | 24 | 5 | iOS (Apple) |
| 24 | 5 | iPhone (iOS 13) |
(Go To: Top | General Summary | Monthly Report | Daily Summary | Hourly Summary | Domain Report | Organisation Report | Operating System Report | Status Code Report | File Size Report | File Type Report | Directory Report | Request Report)
This report lists the HTTP status codes of all requests.
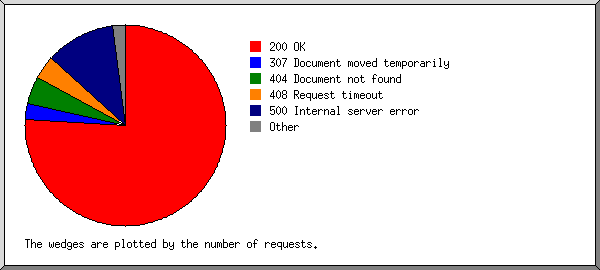
The wedges are plotted by the number of requests.
200 OK
206 Partial content
404 Document not found
500 Internal server error
Other
Listing status codes, sorted numerically.
| reqs | status code |
|---|---|
| 3051 | 200 OK |
| 100 | 206 Partial content |
| 22 | 301 Document moved permanently |
| 21 | 304 Not modified since last retrieval |
| 19 | 307 Document moved temporarily |
| 28 | 400 Bad request |
| 1 | 403 Access forbidden |
| 1355 | 404 Document not found |
| 10 | 408 Request timeout |
| 98 | 500 Internal server error |
(Go To: Top | General Summary | Monthly Report | Daily Summary | Hourly Summary | Domain Report | Organisation Report | Operating System Report | Status Code Report | File Size Report | File Type Report | Directory Report | Request Report)
This report lists the sizes of files.
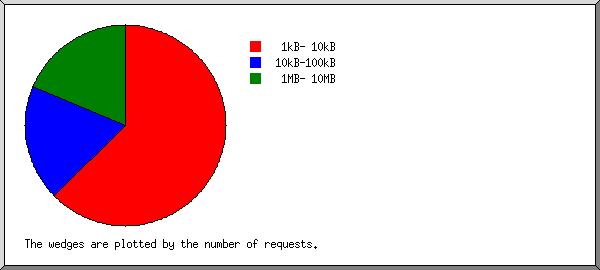
The wedges are plotted by the number of requests.
101B- 1kB
1kB- 10kB
10kB-100kB
100kB- 1MB
| size | reqs | %bytes |
|---|---|---|
| 0 | 0 | |
| 1B- 10B | 0 | |
| 11B- 100B | 0 | |
| 101B- 1kB | 112 | 0.15% |
| 1kB- 10kB | 2439 | 16.00% |
| 10kB-100kB | 486 | 21.24% |
| 100kB- 1MB | 130 | 51.83% |
| 1MB- 10MB | 5 | 10.78% |
(Go To: Top | General Summary | Monthly Report | Daily Summary | Hourly Summary | Domain Report | Organisation Report | Operating System Report | Status Code Report | File Size Report | File Type Report | Directory Report | Request Report)
This report lists the extensions of files.
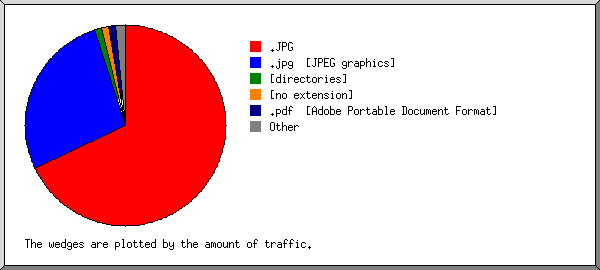
The wedges are plotted by the amount of traffic.
.jpg [JPEG graphics]
.pdf [Adobe Portable Document Format]
[directories]
.png [PNG graphics]
.JPG
.woff
[no extension]
.woff2
.xlf
Other
Listing extensions with at least 0.1% of the traffic, sorted by the amount of traffic.
| reqs | %bytes | extension |
|---|---|---|
| 609 | 46.87% | .jpg [JPEG graphics] |
| 27 | 12.46% | .pdf [Adobe Portable Document Format] |
| 1978 | 12.17% | [directories] |
| 29 | 11.19% | .png [PNG graphics] |
| 6 | 7.26% | .JPG |
| 23 | 2.95% | .woff |
| 155 | 1.88% | [no extension] |
| 19 | 1.82% | .woff2 |
| 49 | 1.23% | .xlf |
| 65 | 0.49% | .rst |
| 74 | 0.45% | .txt [Plain text] |
| 54 | 0.45% | .php [PHP] |
| 9 | 0.24% | .js [JavaScript code] |
| 19 | 0.13% | .ico |
| 17 | 0.11% | .html [Hypertext Markup Language] |
| 39 | 0.28% | [not listed: 10 extensions] |
(Go To: Top | General Summary | Monthly Report | Daily Summary | Hourly Summary | Domain Report | Organisation Report | Operating System Report | Status Code Report | File Size Report | File Type Report | Directory Report | Request Report)
This report lists the directories from which files were requested. (The figures for each directory include all of its subdirectories.)
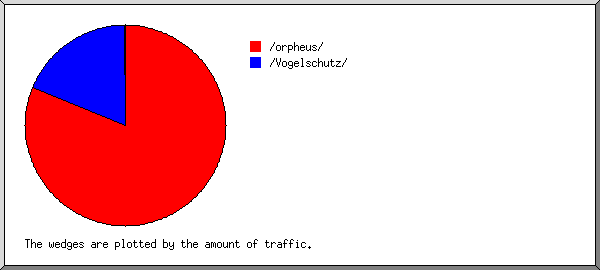
The wedges are plotted by the amount of traffic.
/Vogelschutz/
/orpheus/
[root directory]
Listing directories with at least 0.01% of the traffic, sorted by the amount of traffic.
| reqs | %bytes | directory |
|---|---|---|
| 784 | 59.36% | /Vogelschutz/ |
| 2210 | 39.61% | /orpheus/ |
| 173 | 1.02% | [root directory] |
| 5 | [not listed: 1 directory] |
(Go To: Top | General Summary | Monthly Report | Daily Summary | Hourly Summary | Domain Report | Organisation Report | Operating System Report | Status Code Report | File Size Report | File Type Report | Directory Report | Request Report)
This report lists the files on the site.
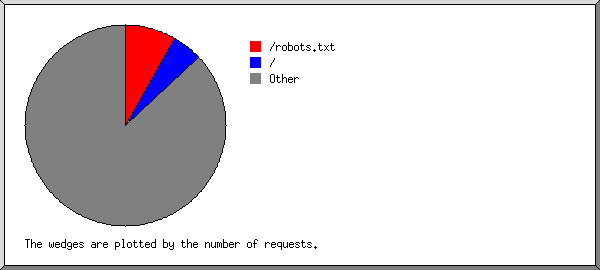
The wedges are plotted by the number of requests.
/
/robots.txt
Other
Listing files with at least 20 requests, sorted by the number of requests.
| reqs | %bytes | last time | file |
|---|---|---|---|
| 88 | 0.50% | 27/Dec/25 22:44 | / |
| 66 | 0.38% | 27/Dec/25 22:39 | /robots.txt |
| 3018 | 99.12% | 27/Dec/25 22:44 | [not listed: 1,750 files] |